collectd is a daemon collecting system and application performance metrics periodically and provides mechanisms to store the values in a variety of ways, for example in RRD files.
What does collectd do?
collectd gathers metrics from various sources, e.g. the operating system, applications, logfiles and external devices, and stores this information or makes it available over the network. Those statistics can be used to monitor systems, find performance bottlenecks (i.e. performance analysis) and predict future system load (i.e. capacity planning). Or if you just want pretty graphs of your private server and are fed up with some homegrown solution you’re at the right place, too ;).
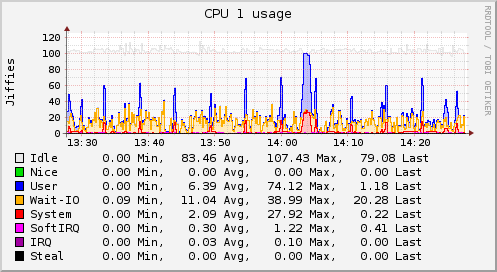
A graph can say more than a thousand words, so here’s a graph showing the CPU utilization of a system over the last 60 minutes:
Why collectd?
There are other free, open source projects that are similar to collectd – a few links are listed on the related sites page. So why should you use collectd? There are some key differences we think set collectd apart. For one, it’s written in C for performance and portability, allowing it to run on systems without scripting language or cron daemon, such as embedded systems. For example, collectd is popular on OpenWrt, a Linux distribution for home routers.
At the same time it includes optimizations and features to handle hundreds of thousands of metrics. The daemon comes with over 100 plugins which range from standard cases to very specialized and advanced topics. It provides powerful networking features and is extensible in numerous ways. Last but not least: collectd is actively developed and supported and well documented. A more complete list of features is available in our wiki.
Limitations
While collectd can do a lot for you and your operational needs, there are limits to what it does:
-
It does not generate graphs. It can write to RRD files, but it cannot generate graphs from these files. There’s a tiny sample script included in
contrib/, though.You can take a look at kcollectd, an X frontend, and ddraw, a very generic solution. More utility programs are listed on the related projects page.
-
Monitoring functionality has been added in version 4.3, but is so far limited to simple threshold checking. The document Notifications and thresholds describes collectd’s monitoring concept and has some details on the limitations, too. Also, there’s a plugin for Nagios, so it can use the metrics provided by collectd.